NFL Final Intelligence
Las Vegas Raiders 7, Denver Broncos 10 — Recap
· Empower Field at Mile High · View Preview
Standouts
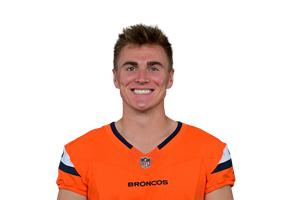
Passing
16/28, 150 YDS, 1 TD, 2 INT
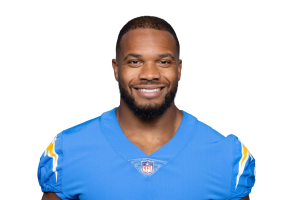
Rushing
18 CAR, 77 YDS
Receiving
5 REC, 44 YDS
Every player's passing, rushing, receiving and defensive line is in the box score below.
📋 Team Stats
LVDEN
188Total yards220
3.2Yards per play3.9
114Passing yards136
74Rushing yards84
10First downs10
27%Third down %33%
100%Red zone scoring %33%
1Turnovers2
6Sacks allowed2
83Penalty yards78
29.2Possession (min)30.8
Box Score
Passing
| Player | Team | C/ATT | YDS | TD | INT |
|---|---|---|---|---|---|
| Geno Smith QB |

|
16/26 | 143 | 0 | 1 |
| Kenny Pickett QB |
|
0/1 | 0 | 0 | 0 |
| Bo Nix QB |

|
16/28 | 150 | 1 | 2 |
Rushing
| Player | Team | CAR | YDS | TD |
|---|---|---|---|---|
| Ashton Jeanty RB |
|
19 | 60 | 1 |
| Geno Smith QB |
|
3 | 7 | 0 |
| Tre Tucker WR |
|
1 | 7 | 0 |
| Raheem Mostert RB |
|
1 | 4 | 0 |
| Brock Bowers TE |
|
1 | -4 | 0 |
| J.K. Dobbins RB |
|
18 | 77 | 0 |
| RJ Harvey RB |
|
4 | 9 | 0 |
| Bo Nix QB |
|
5 | -2 | 0 |
Receiving
| Player | Team | REC | TGT | YDS | TD |
|---|---|---|---|---|---|
| Tyler Lockett WR |
|
5 | 6 | 44 | 0 |
| Brock Bowers TE |
|
1 | 3 | 31 | 0 |
| Tre Tucker WR |
|
2 | 3 | 28 | 0 |
| Michael Mayer TE |
|
3 | 4 | 22 | 0 |
| Raheem Mostert RB |
|
1 | 1 | 11 | 0 |
| Dont'e Thornton Jr. WR |
|
1 | 2 | 4 | 0 |
| Ashton Jeanty RB |
|
3 | 5 | 3 | 0 |
| Pat Bryant WR |
|
1 | 2 | 43 | 0 |
| Troy Franklin WR |
|
5 | 9 | 40 | 1 |
| Courtland Sutton WR |
|
3 | 4 | 24 | 0 |
| Adam Prentice FB |
|
1 | 1 | 13 | 0 |
| Evan Engram TE |
|
2 | 5 | 12 | 0 |
| RJ Harvey RB |
|
2 | 3 | 9 | 0 |
| J.K. Dobbins RB |
|
1 | 1 | 7 | 0 |
| Adam Trautman TE |
|
1 | 1 | 2 | 0 |
Defense
| Player | Team | TKL | SACK | INT | PD |
|---|---|---|---|---|---|
| Jeremy Chinn S |
|
9 | 0 | — | 0 |
| Devin White LB |
|
7 | 0 | — | 0 |
| Charles Snowden LB |
|
6 | 1 | — | 1 |
| Maxx Crosby DE |
|
5 | 0 | — | 0 |
| Jamal Adams LB |
|
3 | 0 | — | 0 |
| Lonnie Johnson Jr. S |
|
3 | 0 | — | 0 |
| Jonah Laulu DT |
|
3 | 0 | — | 1 |
| Isaiah Pola-Mao S |
|
3 | 0 | — | 0 |
| Eric Stokes CB |
|
3 | 0 | — | 0 |
| Thomas Booker IV DT |
|
2 | 0 | — | 0 |
| Adam Butler DT |
|
2 | 1 | — | 0 |
| Tommy Eichenberg LB |
|
2 | 0 | — | 0 |
| Michael Mayer TE |
|
2 | 0 | — | 0 |
| Darien Porter CB |
|
2 | 0 | — | 0 |
| Elandon Roberts LB |
|
2 | 0 | — | 0 |
| Tyree Wilson DE |
|
2 | 0 | — | 0 |
| Jacob Bobenmoyer LS |
|
1 | 0 | — | 0 |
| Tonka Hemingway DT |
|
1 | 0 | — | 0 |
| Kyu Blu Kelly CB |
|
1 | 0 | 2 | 2 |
| Cody Lindenberg LB |
|
1 | 0 | — | 0 |
| Jon Rhattigan LB |
|
1 | 0 | — | 0 |
| Talanoa Hufanga S |
|
9 | 1 | — | 0 |
| Alex Singleton LB |
|
9 | 0 | — | 0 |
| Nik Bonitto LB |
|
5 | 1.5 | — | 0 |
| Dre Greenlaw LB |
|
5 | 0 | — | 1 |
| Brandon Jones S |
|
5 | 0 | — | 0 |
| Riley Moss CB |
|
5 | 0 | — | 0 |
| Zach Allen DE |
|
4 | 1 | — | 1 |
| Jahdae Barron CB |
|
3 | 0 | — | 0 |
| John Franklin-Myers DE |
|
3 | 0.5 | — | 0 |
| Malcolm Roach DT |
|
3 | 1 | — | 0 |
| Dondrea Tillman LB |
|
3 | 0 | 1 | 1 |
| Eyioma Uwazurike DE |
|
3 | 0.5 | — | 0 |
| Jonathon Cooper LB |
|
2 | 0.5 | — | 0 |
| Ja'Quan McMillian CB |
|
2 | 0 | — | 0 |
| Pat Bryant WR |
|
1 | 0 | — | 0 |
| Troy Franklin WR |
|
1 | 0 | — | 0 |
| D.J. Jones DT |
|
1 | 0 | — | 0 |
| Devon Key S |
|
1 | 0 | — | 0 |
| Adam Prentice FB |
|
1 | 0 | — | 0 |
| JL Skinner S |
|
1 | 0 | — | 0 |
| Justin Strnad LB |
|
1 | 0 | — | 0 |
| Adam Trautman TE |
|
1 | 0 | — | 0 |
⏱️ Snap Counts
LV offenseShare of the team's offensive or defensive snaps
| Player | Pos | Snaps | Share |
|---|---|---|---|
| DJ Glaze | OT | 60 | 100% |
| Jordan Meredith | C | 60 | 100% |
| Stone Forsythe | OT | 60 | 100% |
| Tre Tucker | WR | 60 | 100% |
| Geno Smith | QB | 58 | 97% |
| Ashton Jeanty | RB | 52 | 87% |
| Brock Bowers | TE | 50 | 83% |
| Alex Cappa | G | 39 | 65% |
| Michael Mayer | TE | 37 | 62% |
| Dont'e Thornton Jr. | WR | 37 | 62% |
| Tyler Lockett | WR | 34 | 57% |
LV defenseShare of the team's offensive or defensive snaps
| Player | Pos | Snaps | Share |
|---|---|---|---|
| Isaiah Pola-Mao | S | 61 | 100% |
| Jeremy Chinn | S | 61 | 100% |
| Maxx Crosby | DE | 61 | 100% |
| Eric Stokes | CB | 61 | 100% |
| Devin White | LB | 61 | 100% |
| Jonah Laulu | DT | 49 | 80% |
| Adam Butler | DT | 48 | 79% |
| Lonnie Johnson Jr. | S | 36 | 59% |
| Kyu Blu Kelly | CB | 35 | 57% |
| Jamal Adams | LB | 29 | 48% |
| Charles Snowden | LB | 27 | 44% |
DEN offenseShare of the team's offensive or defensive snaps
| Player | Pos | Snaps | Share |
|---|---|---|---|
| Alex Palczewski | OT | 61 | 100% |
| Luke Wattenberg | C | 61 | 100% |
| Mike McGlinchey | OT | 61 | 100% |
| Garett Bolles | OT | 61 | 100% |
| Bo Nix | QB | 61 | 100% |
| Courtland Sutton | WR | 53 | 87% |
| Troy Franklin | WR | 45 | 74% |
| Adam Trautman | TE | 42 | 69% |
| Quinn Meinerz | G | 38 | 62% |
| J.K. Dobbins | RB | 32 | 52% |
| Pat Bryant | WR | 30 | 49% |
DEN defenseShare of the team's offensive or defensive snaps
| Player | Pos | Snaps | Share |
|---|---|---|---|
| Talanoa Hufanga | S | 60 | 100% |
| Riley Moss | CB | 60 | 100% |
| Alex Singleton | LB | 60 | 100% |
| Brandon Jones | S | 60 | 100% |
| Ja'Quan McMillian | CB | 57 | 95% |
| Kris Abrams-Draine | CB | 47 | 78% |
| Jonathon Cooper | LB | 42 | 70% |
| Nik Bonitto | LB | 40 | 67% |
| Dre Greenlaw | LB | 37 | 62% |
| Zach Allen | DE | 35 | 58% |
| John Franklin-Myers | DE | 32 | 53% |
⚔️ Season Series & What's Next
2025 season series
LV 0
–
1 DEN
After this game
Sharper Picks Start Here
Live odds, Key Suspects, player props, DFS rankings, and real-time game tracking — all in one workspace built for serious bettors and DFS players.